Microsoft's advantage is not a single AI product. It is a system position across enterprise distribution, data, identity, and cloud compute. The investment question comes down to two tests: whether Microsoft keeps the incremental AI/cloud wallet of existing customers, and whether Azure capex converts into durable free cash flow.
01 · Executive Summary
Microsoft remains a very high-quality business, but the controversy is now concentrated. The market is repricing AI capex, free cash flow quality, and the durability of the cloud return cycle.
The profit machine still works
FY2025 revenue was $281.7B, operating income was $128.5B, and operating margin was 45.6%, with continued double-digit growth.
PBP earns, Azure grows
Productivity and Business Processes is the largest profit pool. Azure is the growth engine and the center of AI capex risk.
Office disruption is not yet fact
M365 Commercial still grows and seats are still expanding. The evidence to watch is Copilot attachment, activation, and customer AI wallet share.
Cheap on earnings, not on FCF
The P/E multiple has fallen toward roughly 22x, but capex compresses free cash flow, so valuation is less cheap on cash flow.
Can Microsoft keep enterprise AI budgets inside its data, identity, and cloud system, while converting roughly $190B of annualised capex into durable free cash flow?
02 · Three Businesses And Profit Structure
Microsoft is not a single software business. It combines high-margin productivity subscriptions, cloud infrastructure growth, and a personal computing cash-flow layer.
| Segment | Revenue | Operating Income | Role |
|---|---|---|---|
| Productivity and Business Processes | $120.8B | $69.8B | Office/M365, LinkedIn, Dynamics. The profit cow, about 54% of segment operating income. |
| Intelligent Cloud | $106.3B | $44.6B | Azure, server products, enterprise services. The growth engine and the center of AI capex debate. |
| More Personal Computing | $54.6B | $14.2B | Windows, gaming, search, and devices. Still useful cash flow, but not the main investment question. |
The product-line view confirms the segment picture: server and cloud services, M365 Commercial, gaming, LinkedIn, Windows, search advertising, Dynamics, and services together form the $281.7B revenue base. The largest profit pool remains enterprise customers.
Latest-quarter signal
FY2026 Q3 showed continued acceleration in cloud and AI: revenue of $82.9B, operating income of $38.4B, continued PBP growth, faster Intelligent Cloud growth, Azure growth of roughly 40%, and AI annual run-rate above $37B. The near-term data support the bull case, but they also make capex return the central question.
03 · Moat: Distribution, Data, Identity, Suite
Microsoft's moat is not that only Microsoft can build AI. The moat is that Microsoft already sits inside enterprise workflow, permissions, data, and procurement.
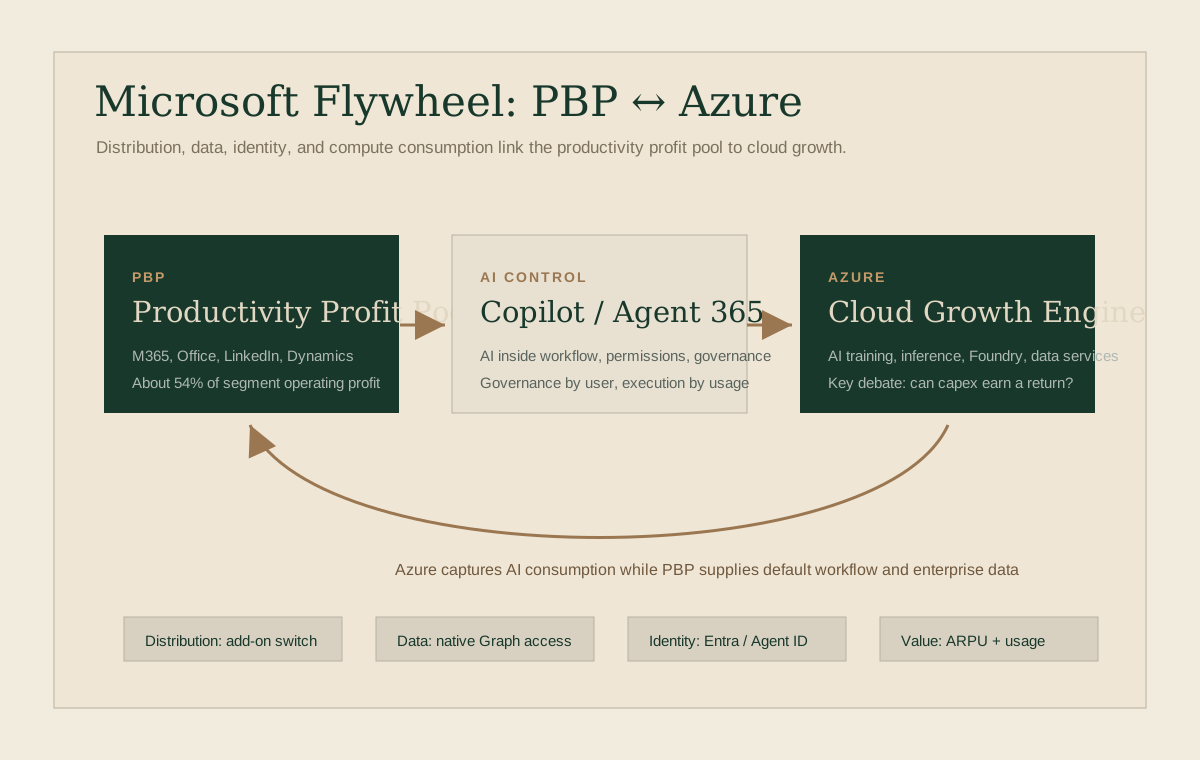
- Customers already buy M365, Entra, security, and Azure services
- Copilot can enter Outlook, Teams, Excel, and enterprise Graph
- Agent 365 extends identity, compliance, and security to AI agents
- AI execution and consumption can flow back to Azure usage
The security claim needs precision. ChatGPT Enterprise, Claude Enterprise, and API contracts can also promise not to train on customer data. Copilot's sharper edge is lower friction: the data and permissions already live inside the Microsoft tenant.
Azure also has its own moat: data gravity, managed services, enterprise relationships, hybrid cloud, compliance, and global regions. PBP helps Azure, but it is not Azure's only foundation.
04 · Office And AI: Story Versus Evidence
AI disruption of Office is a credible forward-looking risk, but as of this note it is not yet an observed fact.
| Bear mechanism | Current evidence | Investment implication |
|---|---|---|
| Seat-based SaaS gets compressed by AI | M365 Commercial still grows at double-digit rates, and seats are still expanding. | The risk matters, but unobserved erosion should not be treated as fact. |
| The work interface shifts to chat or agents | ChatGPT, Claude, and Gemini are strong in preference and developer use cases. Copilot satisfaction is not clearly leading. | Microsoft must defend the default work surface, not just the document backend. |
| Lower software creation cost creates challengers | This affects the whole productivity SaaS category, including Google Workspace, Salesforce, and Workday. | The question is not whether Microsoft alone is exposed, but who is best defended. |
The key variable for M365 Copilot is not current revenue size. It is attach rate and long-term ARPU. With more than 20M seats and roughly 3.3% to 4.4% attachment, the upside is large, but still unproven. If Copilot and agents become a workflow layer, PBP can lift ARPU. If users buy but do not activate, or if the default work surface moves to outside assistants, the upside weakens.
05 · Azure And The Capex Bet
Microsoft's main stock swing factor increasingly resembles the NVIDIA framework: whether AI demand compounds, and who captures the value.
| Metric | Signal | Risk to watch |
|---|---|---|
| Cloud share | AWS roughly 28%, Azure roughly 21%, GCP roughly 14%. Azure is the clear number two and growing quickly. | Large enterprises are multi-cloud. PBP creates preference, not absolute lock-in. |
| RPO | Commercial remaining performance obligation around $627B, roughly +99% year over year. | About 45% is tied to OpenAI, so demand quality should be assessed separately. |
| Capex | Large technology AI infrastructure spending continues to surge, with Microsoft around the $190B annualised level. | Cash leaves first, depreciation arrives first, and returns arrive later with uncertainty. |
| Free cash flow | FY2025 FCF was roughly $71.6B. | FCF declined year over year as capex rose. EPS alone can hide the pressure. |
Power, data centers, cooling, HBM, advanced packaging, and grid connection are becoming real constraints. Microsoft's long-term nuclear PPA shows that the bottleneck is now broader than chip availability.
06 · Competition: Google Is Symmetric, But Not Alone
Microsoft is not in a single duel. It competes across several battlefields, and each battlefield has a different first rival.
| Battlefield | Microsoft position | Main rivals |
|---|---|---|
| Cloud infrastructure | Azure is number two with strong enterprise relationships. | AWS is largest, GCP is growing quickly. |
| Productivity suite | M365 leads in large enterprises and revenue share. | Google Workspace is stronger in SMB, education, and domain-count measures. |
| AI models and assistants | Copilot has distribution, but weaker consumer preference. | OpenAI, Anthropic, Google. |
| Developers | GitHub Copilot started strong, but competition is intensifying. | Cursor, Claude Code, OpenAI Codex-style tools. |
| Enterprise applications | Dynamics links to M365 and Power Platform. | Salesforce, Oracle, SAP, ServiceNow. |
The real Office rival is Google Workspace, not Apple. Apple is a device and consumer-interface company; iWork is not the main enterprise suite competitor. The AI risk is also symmetric: if AI work surfaces compress office suites, both Microsoft and Google are exposed.
07 · OpenAI Relationship And Agent Governance
OpenAI is an asset, a customer, and a competitor. Agent 365 is Microsoft's attempt to keep a control layer in a multi-model world.
OpenAI: asset, demand, uncertainty
Microsoft owns roughly 27% of OpenAI and remains one of its largest investors, while ChatGPT competes with Copilot for user attention. The 2026 relationship changes reduced Azure exclusivity, preserved selected commercial rights, and made single-customer concentration more visible.
Agent 365: extending Entra and security to agents
Agent 365 does not mean Microsoft monopolises agent identity. The point is to bring enterprise identity, audit, compliance, data governance, and security into the agent era. Even third-party agents need to be inventoried, authorised, monitored, and billed. Microsoft's opportunity is to become a governance layer for workplace AI.
AWS, Google, Okta, CyberArk, Salesforce, and ServiceNow will each build agent governance in their own domains.
For Microsoft, this is more like incremental Entra, security, E5/E7, and Azure consumption than a standalone mega-TAM.
Governance can be priced by user, while execution is priced by agent usage, helping offset seat compression.
If neutral cross-cloud platforms become the default, Microsoft's governance tax rate may be lower.
08 · Valuation: Earnings Multiple Down, FCF Quality Pressured
Business quality is visible. The hard question is what multiple the market should pay while AI capex is being repriced.
| Metric | Approximate level | Interpretation |
|---|---|---|
| Market value | About $2.62T | Still one of the world's largest high-quality compounders. |
| P/E | About 22x | Below recent median levels and year-start levels, a meaningful earnings de-rating. |
| P/FCF | About 37x | Free cash flow is compressed by capex, so it is less cheap on a cash-flow basis. |
| Dividend and buyback | Yield about 1%, payout ratio about 21% | Capacity exists, but future capital return is more constrained by capex. |
This is not a simple "great company, therefore great stock" setup. Bulls need AI capex to become high-quality revenue and cash flow. Bears expect free cash flow quality, competition, concentration, or depreciation to keep pressuring valuation.
09 · Bull, Base, Bear, And Failure Conditions
AI cloud demand keeps compounding
Azure stays in high growth, Copilot and Agent 365 lift ARPU, OpenAI continues to contribute demand and equity value, and lower P/E provides margin of safety.
Excellent business, normalising return
Office remains stable and Azure grows, but capex and depreciation pressure FCF. The company remains excellent, while stock returns depend more on entry price.
Investment arrives before return
RPO concentration matters, OpenAI relationship weakens, AI budgets flow to outside assistants or other clouds, FCF keeps falling, and valuation compresses further.
If M365 seats and ARPU peak, Copilot attachment and activation stall, enterprise AI wallet share moves outside Microsoft, Azure AI growth slows, FCF is repeatedly consumed by capex, or OpenAI concentration risk materialises, the bull case needs to be revisited.
10 · Quarterly Monitoring Dashboard
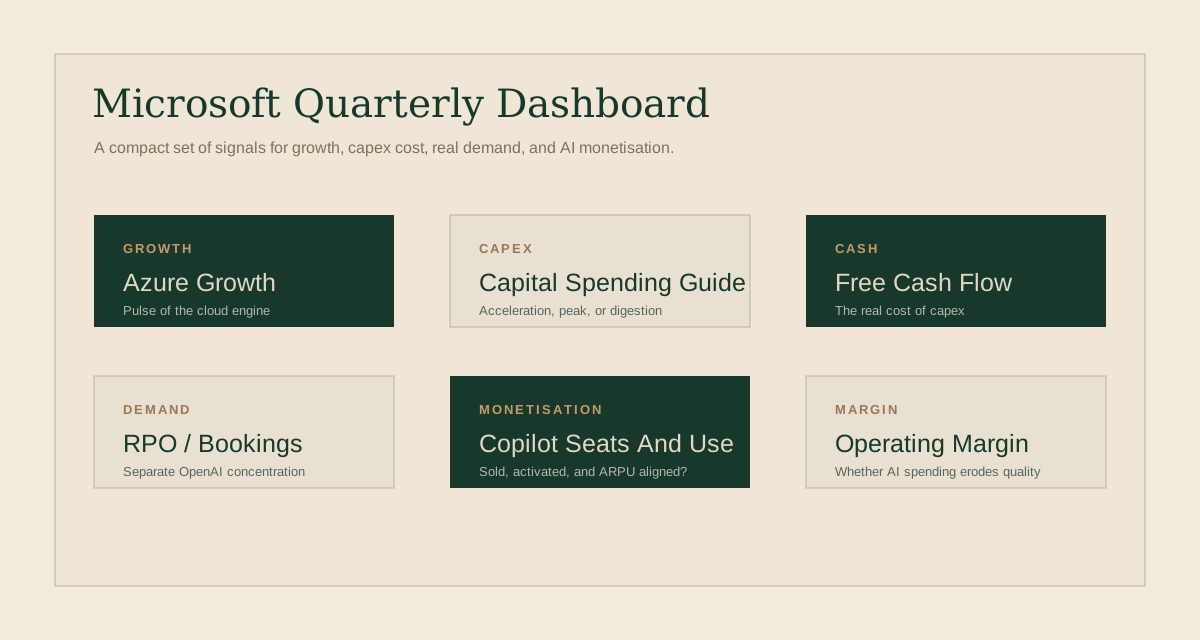
The framework should be reviewed each quarter by putting growth, investment, demand quality, and AI monetisation on the same page.
| Metric | Why it matters |
|---|---|
| Azure growth | Shows whether the cloud engine remains supply-constrained and high-growth. |
| Capital spending guide | Signals whether AI infrastructure spending is accelerating, peaking, or entering digestion. |
| Free cash flow | Measures the real cost of capex, not just revenue and EPS. |
| RPO / bookings | OpenAI concentration should be separated to assess underlying demand quality. |
| Copilot seats and activation | Separates sold seats, actual usage, and sustainable ARPU. |
| Operating margin | Shows whether AI investment is eroding cloud margins or company-wide profitability. |
Sources, Method, And Disclaimer
Data and judgments are as of 26 June 2026. This note is adapted from an internal research discussion and public research materials. Primary source categories include Microsoft FY2025 and FY2026 Q3 financial materials, investor relations materials, SEC filings, cloud market research, public industry reporting, and AI value-chain research. Source definitions vary for Copilot, AI run-rate, agent identity market sizing, and cloud share, so the note should be read as a framework rather than a precise forecast.
- Microsoft annual reports, quarterly results, investor relations materials, and SEC filings.
- Public materials on cloud infrastructure share, AI infrastructure capex, RPO, the OpenAI relationship, and Agent 365.
- Public frameworks from McKinsey, Goldman, PwC, and other sources on AI economic value and TAM.
This note is general research and information only. It is not investment advice, financial product advice, a securities recommendation, an offer, or a solicitation. Valuation, market prices, and business data change over time, and any investment decision should rely on independent judgment and professional advice.