Preserving purchasing power is only the floor. A better objective for long-term family capital is after-tax, after-withdrawal net worth growth relative to the growth of the broader wealth pool.
01 · Core Conclusion
If the asset-owning economy compounds at mid- to high-single-digit nominal rates, a portfolio built only around low volatility and deposit income can avoid losses while still losing relative position.
CPI measures living costs
Beating CPI helps preserve day-to-day purchasing power, but it does not prove that relative asset position has been maintained.
Net worth is a balance sheet
Wealth position is about the growth of asset stock, not only annual output or consumer prices.
Deposits manage liquidity
Cash and term deposits are useful for living expenses, tax payments, and near-term commitments, but they are not the whole growth engine.
Returns must survive tax and withdrawals
Social wealth growth is observed after households have consumed. A family portfolio has to cover tax and withdrawals before measuring net compounding.
If the objective is to preserve relative wealth position, the required return is not simply CPI plus a spread. It is the total return needed to compound after tax and after withdrawals.
02 · The Right Benchmark Is Net Worth
GDP is a flow. CPI is a price index. Household net worth is closer to the balance sheet that determines relative position among asset owners.
| Metric | What it measures | Question it answers |
|---|---|---|
| CPI | Prices of consumer goods and services | Has daily purchasing power been eroded? |
| GDP growth | Annual output and income in the economy | How much new income was produced this year? |
| Household net worth | Household assets less liabilities | How fast is the asset-owning household sector getting wealthier? |
| Family net worth growth | After-tax, after-withdrawal compounding | Is this family maintaining or improving its relative wealth position? |
The objective should not be reduced to finding a product that beats inflation. The better question is whether the capital system can participate in wealth-pool growth after taxes, spending needs, liquidity reserves, and risk limits.
03 · Why A 4.5% Deposit Can Still Fall Behind
Low volatility feels safe, but relative wealth position is set by compounding. The long-term risk in deposits is often not mark-to-market loss. It is falling behind assets that compound faster.
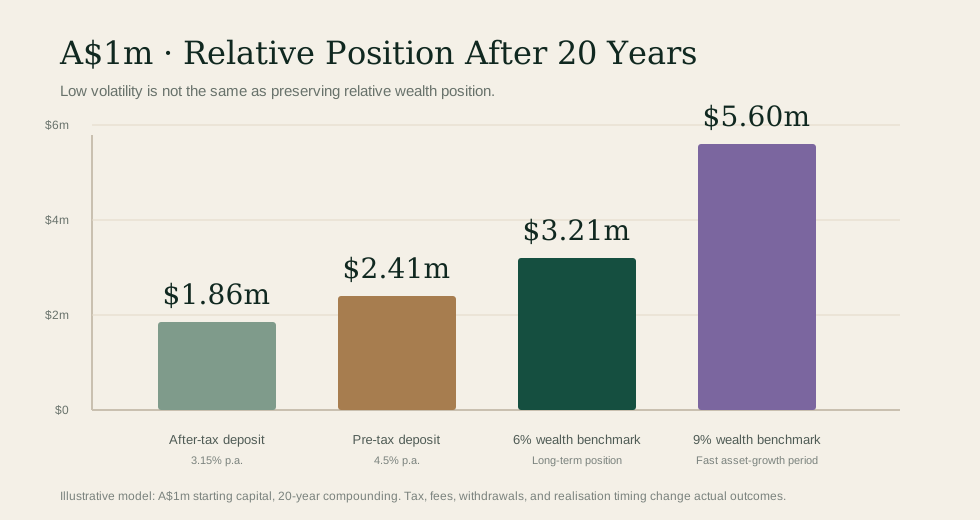
In a simplified A$1m, 20-year model, a 4.5% pre-tax deposit rate grows to roughly A$2.41m. At a 30% effective tax rate, the after-tax path reaches roughly A$1.86m. A 6% wealth benchmark reaches about A$3.21m; a 9% benchmark reaches about A$5.60m.
This does not make cash useless. Liquidity is essential. The point is narrower: a liquidity instrument should not be mistaken for the whole long-term wealth engine.
04 · What Public Data Suggests
Sources and definitions differ across markets, but they point to the same broad lesson: the wealth pool of asset owners tends to grow faster than CPI+0 over long periods.
| Market | Reference frame | Research implication |
|---|---|---|
| Australia | Household wealth and national balance-sheet data point to mid-single-digit nominal wealth growth over long periods, with faster periods during asset booms. | Housing, superannuation, business equity, and financial assets all contribute to household wealth growth. |
| Global | UBS Global Wealth Report provides a framework for long-term personal wealth growth. | Global wealth is not only inflation compensation; it includes real asset and business-equity compounding. |
| United States | Federal Reserve / FRED household and nonprofit net worth series tracks the long-term household balance sheet. | Equities, private business value, pensions, and property all drive net worth growth. |
| China | Past wealth growth was shaped by property, urbanisation, and a lower starting base. | Past high growth should not be extrapolated mechanically when the structure changes. |
The point is not to rank countries mechanically. It is to put family net worth growth on the same page as the growth of the asset-owning economy.
05 · Tax And Withdrawals Raise The Required Return
Observed social wealth growth is already a net result after household consumption. A family portfolio has to deal with tax, spending, and realisation timing first.
- Define target net worth growth
- Add annual withdrawal needs
- Adjust for income and capital gains tax
- Translate into pre-tax total return
A simplified expression is: required after-tax return is approximately target net worth growth plus the withdrawal rate. If a family withdraws 1% of assets each year and still wants net worth to grow by 6% after withdrawals, the portfolio must approach 7% after tax. If that 1% cash flow is funded from taxable income, the pre-tax requirement is higher.
06 · An Illustrative A$1m Case
The model is not a record of any family asset base. It uses a simple round number to make the mechanics visible.
| Objective | After-tax capital target after 20 years | Required pre-tax capital growth | Pre-tax economic return including A$10k after-tax cash flow |
|---|---|---|---|
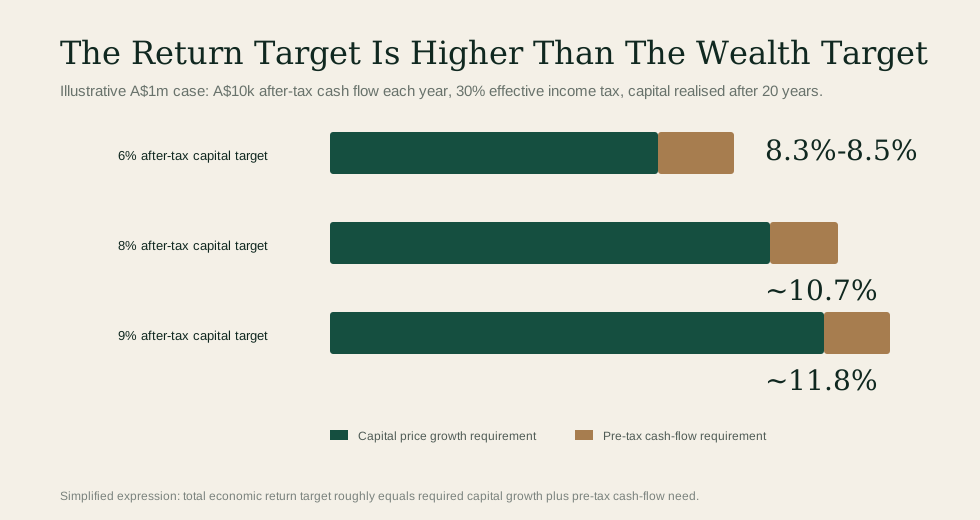
| 6% after-tax capital CAGR | About A$3.21m | About 6.91% | About 8.3%-8.5% |
| 8% after-tax capital CAGR | About A$4.66m | About 9.27% | About 10.7% |
| 9% after-tax capital CAGR | About A$5.60m | About 10.40% | About 11.8% |
The most common mistake is to read 6.91%, 9.27%, and 10.40% as total portfolio return targets. They are only capital price growth requirements under a specific tax model. If the family also needs A$10k of after-tax annual cash flow, the total economic return target rises.
07 · Portfolio Implications
This framework does not argue for reckless risk-taking. It argues for a system that separates liquidity, growth, tax, and governance.
Cash-flow layer
Reserve liquidity for living expenses, tax payments, and near-term needs so growth assets are not sold at the wrong time.
Growth layer
Use equities, business ownership, quality property, private assets, or diversified growth assets to participate in long-term compounding.
Tax layer
Realisation timing, holding structure, capital gains deferral, franking credits, superannuation, trusts, and companies all affect after-tax compounding.
| Mistake | Why it is dangerous | Better framing |
|---|---|---|
| Chasing high yield | Income can accelerate tax, and high yield is not the same as high total return. | Focus on after-tax total return, not only cash yield. |
| Treating deposits as the long-term safe asset | Deposits have low volatility but can lose relative position over time. | Use deposits for liquidity, and growth assets for long-term objectives. |
| Using CPI as the only benchmark | CPI measures living costs, not the competition among asset owners. | Include household net worth growth in target setting. |
08 · Method And Disclaimer
Data and judgments are as of 15 June 2026. This is a target-setting framework, not a forecast. All A$1m cases are illustrative and exclude management fees, platform costs, transaction costs, currency effects, personalised tax structures, and specific family arrangements.
- Australian Bureau of Statistics - Household Income and Wealth
- Australian Bureau of Statistics - Australian National Accounts: Finance and Wealth
- UBS Global Wealth Report 2025
- Federal Reserve / FRED - Households and Nonprofit Organizations Net Worth
- Australian Government Budget 2026-27 - Tax reform
The tax model is simplified. Budget 2026-27 tax measures should be read subject to government releases and final legislation. This note is general research and information only. It is not investment advice, financial product advice, tax advice, legal advice, an offer, or a solicitation.